Hubway Data Challenge
🏆 2017 “Most Artistic” Hubway Data Challenge Award Winner
Role: Project Management, UX Design, UI Design
Hubway (now BlueBikes) is a bikeshare system based in Boston, MA. Each year, the company releases their data publicly alongside a call for entries to their Data Challenge: a competition to visualize and pull insights from Hubway's annual data. I led a team of data analysts, software developers, and designers at Sasaki to produce an entry that won the "Most Artistic" award in the 2017 Hubway Data Challenge.
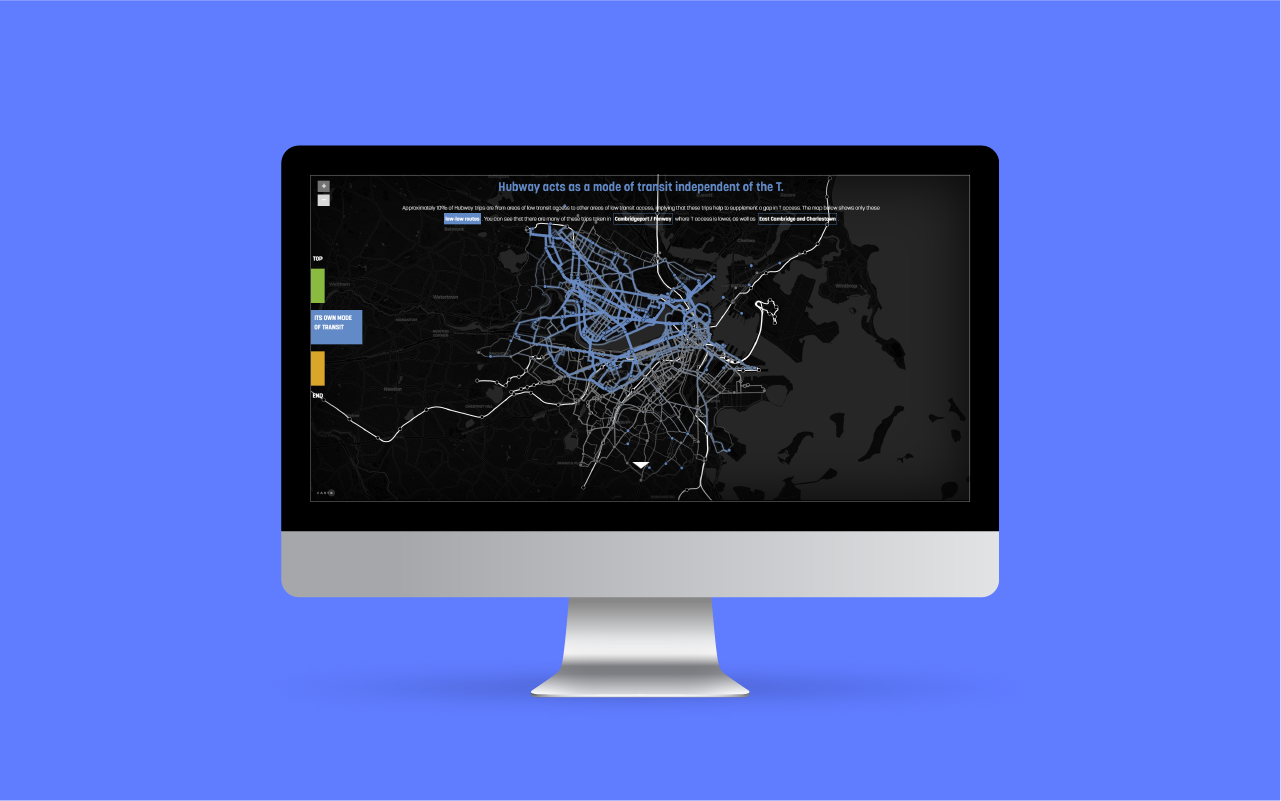
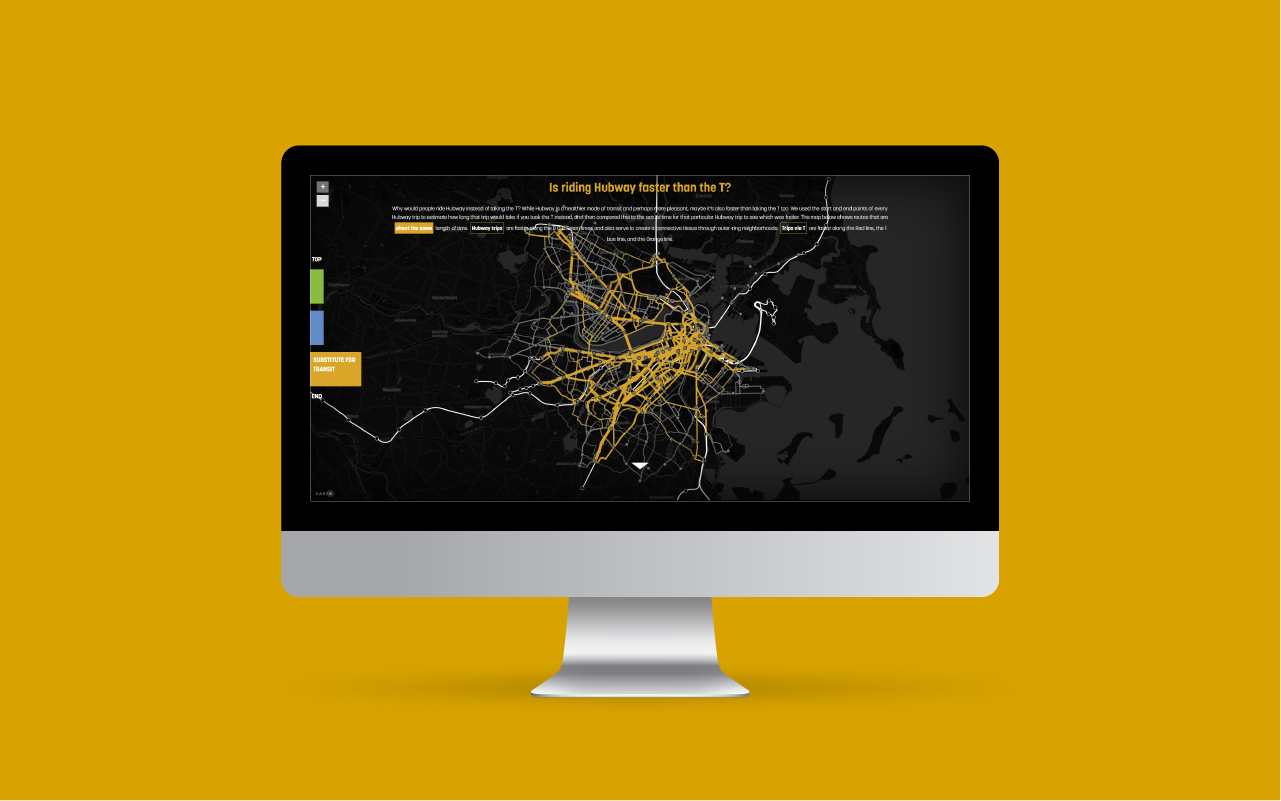
Our team wanted to understand how the Hubway system supplemented, competed with, or worked alongside the existing transit system in Boston. Using OpenTripPlanner and OpenStreetMap, we calculated a transit accessibility score for each Hubway station and the probable route taken for all Hubway trips. By visualizing these calculations, we found three primary roles that Hubway plays in the greater Boston transit system: Hubway functions as a first/last mile connector (approximately 20% of Hubway trips), as its own mode of transit to supplement a gap in transit access (approx. 10%), and as a substitute for transit (approx. 15%). The visualization that we built told this story step-by-step with accompanying maps and interactive features along the way, including a fully explorable map of the data at the end.
My role was two-fold: project manager and UX/UI designer. As project manager, I worked with the team to coalesce a clear, tight narrative about the data and coordinated team members' responsibilities to bring together the front end and back end pieces of the visualization within a four-week timeline. As UX/UI designer, I created a storyboard, wireframes, and mockups, and then worked alongside the front end developer to implement using React. Our team was thrilled to receive the "Most Artistic" award from Hubway for this entry.